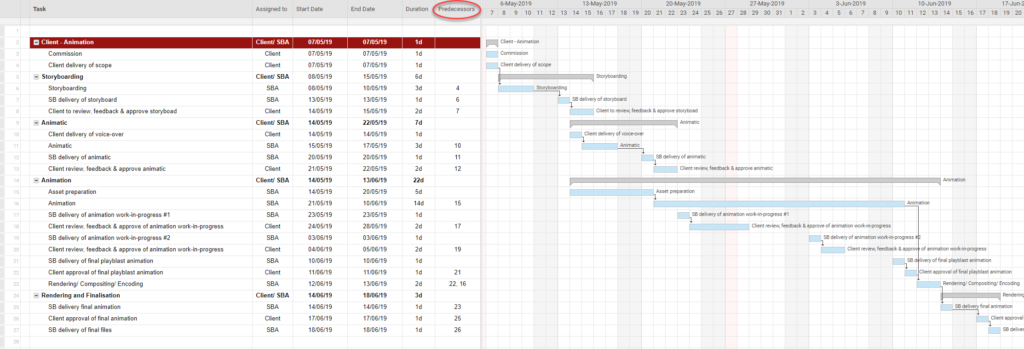
A Gantt chart is a widely used project management tool that is an invaluable part of the planning process when producing an animation project. First devised by Polish engineer Karol Adamiecki in the 1890s, they were then popularised by Henry Gantt 15 years later in America, thus becoming known as ‘Gantt’ charts.
The charts are a useful way of knowing where you are with an animation at a glance, as you are able to view tasks displayed against time. In addition to this, you can easily see the start and end dates and duration of activities, as well as who each task is assigned to.
The main advantage of using a Gantt chart instead of a schedule made in Excel is you are able to change dates and have the chart automatically update itself to reflect these, rather than having to spend a long time manually editing.
Gantt charts are particularly helpful if you are working with a team because they allow everyone to see what stage the animation is at, and who is working on what. Likewise, they help colleagues to understand the relationships between tasks, and see what impact missing their deadline may have on the next task or the whole animation.
Being able to see projects on a larger scale also permits you to allocate resources more effectively as you can see exactly when and what team members are working on. Below is a tutorial on how to create your own Gantt chart.
1. Getting started with a Gantt Chart
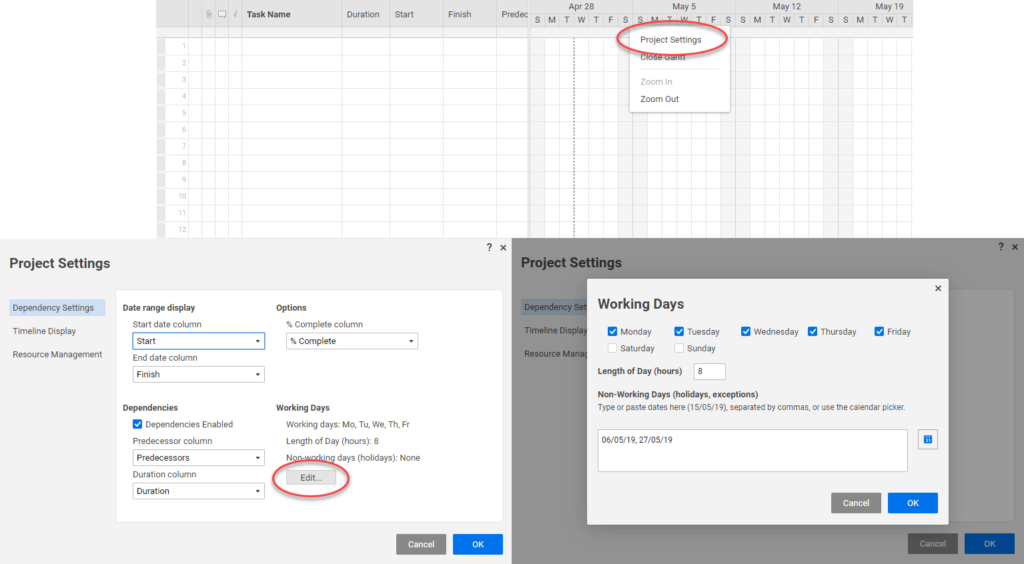
Start by setting up your project calendar in the software or application you are using (we use Smartsheet) to establish working and non-working days, and which day your week starts on. In Smartsheet you do this by right clicking anywhere on the dates at the top of the right side of the Gantt chart, and the clicking ‘Project settings’.
2. Set your start and end dates
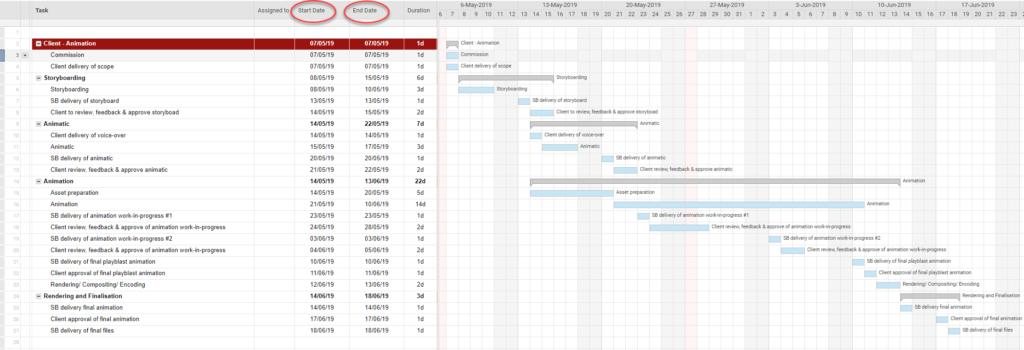
Ideally, you will have planned out your dates before coming to creating a Gantt chart schedule. The first things you will need to consider are the start and end dates of your animation project. Create rows at the top and bottom of your sheet and enter these in as ‘Commission’ and ‘Delivery’, then add your dates into the start and end date columns. You will see these appear as blocks in the Gantt part of the chart.
3. Organise your tasks
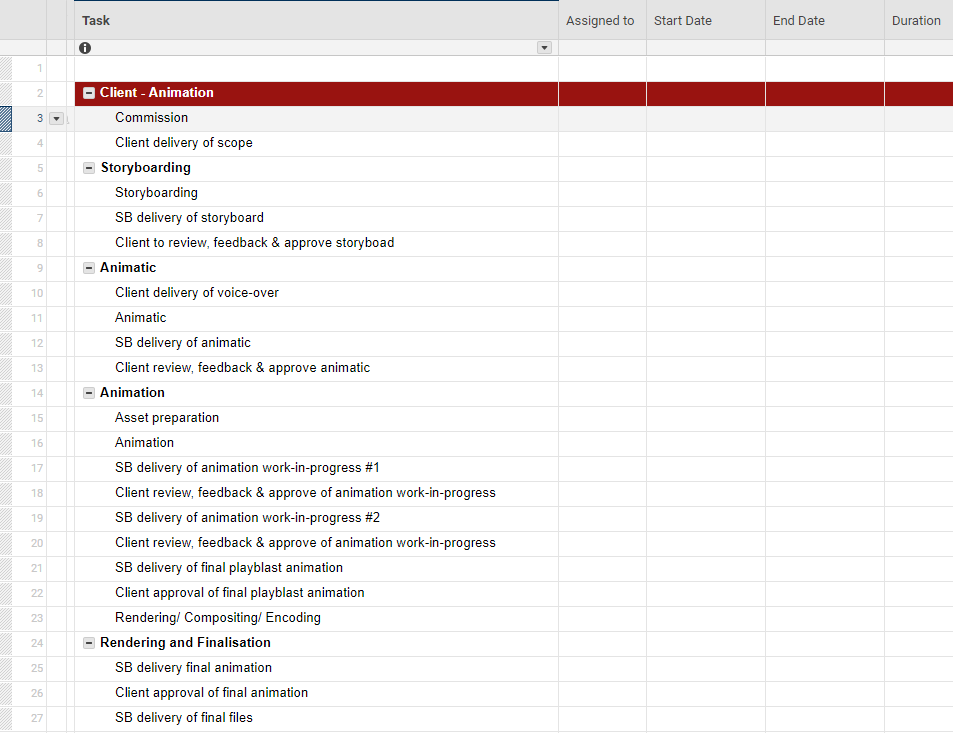
Once you have these in place you can move on to your tasks. Enter these into a separate row for each activity, and then organise these into subtasks in indented rows underneath using the Indent tool. When working on an animation you will normally have a long list of tasks to keep track of, so this step can be really helpful.
4. Enter your start and end dates for your tasks
When you have your tasks in place you can start adding the start and finish dates for each of these. This is where Gantt charts are hugely useful – they allow you to see your animation project visually, making it easy to see how long you have for each task, and how this changes if you input different dates.
5. Assign responsible parties
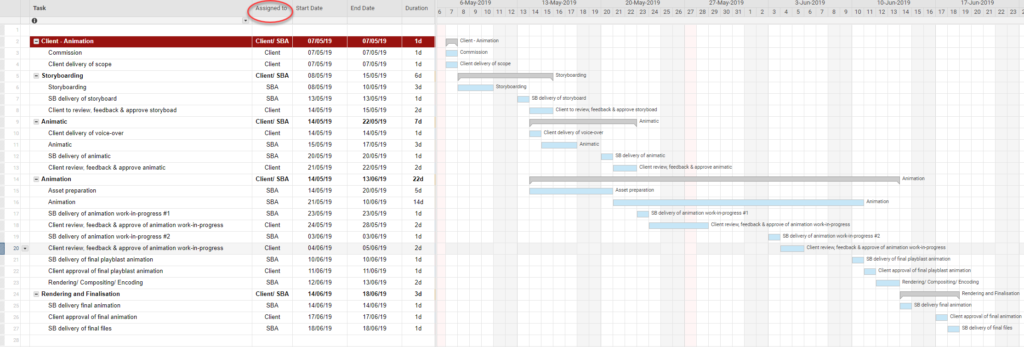
After this you can commit your resources to activities by adding the responsible person or team for each task to the ‘Assigned to’ column. If you are a small team you might want to just use your studio or company name or initials for everyone’s tasks, and then use those of your client for any deliverables or approvals that are their responsibility. For larger teams it might be more helpful to use each colleague’s first name or initials, so you can see who is responsible for each part of the animation.
6. Gantt Chart Dependencies
The final things to consider are your dependencies. Some tasks will be dependent on other parts of the animation being completed, so you need to show this in your Gantt chart. Most applications allow you to drag an arrow from one activity to another, but you can also input this manually with numbers. In some instances you may find that a task is dependent on one before it, but you don’t want to schedule it to start right after the previous one has finished. In this case, you will need to set a lag to tell the software to shift it forward. In Smartsheet you can do this in the dependencies column by entering + and then the number of days in between the task and the predecessor it is dependent on.
7. Styles
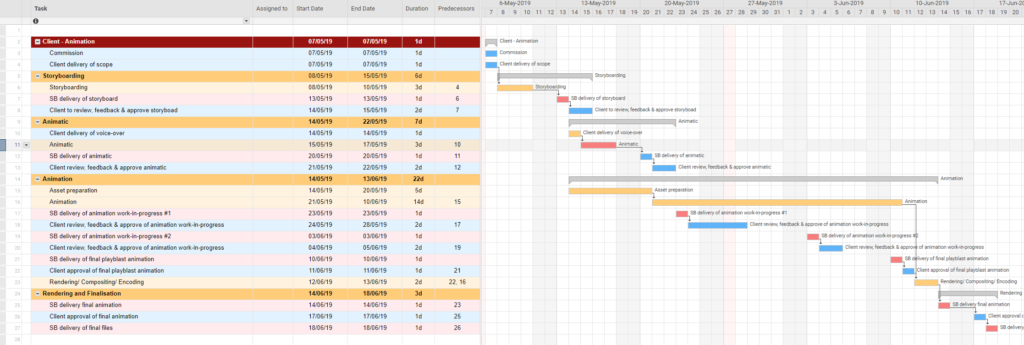
Once you have all of these elements in your Gantt chart, you might want to use colours and different font styles to help separate resources, and differentiate tasks from subtasks. Using a standalone colour for deliverables can be particularly useful, as it will help them stand out when your team look at the schedule, allowing the animation project to stay on track. The tools for this are normally similar to that of Microsoft Office.
8. Finalising your Gantt Chart – check, check, and check again
The key thing with any Gantt chart is to keep coming back to your schedule to check whether your animation project is on track, and to see when you have agreed to deliver things, such as the storyboard, work-in-progress files etc. If you are behind with any tasks you will need top adjust your duration dates to see how this will effect the project.
If you are not already utilising Gantt charts in your workflow, try creating one when you’re planning your team’s next animation, and see for yourself how worthwhile a tool they can be, and how it helps your project to stay on track.
For further reading please see What To Expect When Working On A Project With Sliced Bread. Or if you would like to know more about how being creative can support your corporate communications. Please feel free to drop us a line at info@sbanimation.com
